HTML Reporter
Overview
Nightwatch v2.2 brings its own integrated HTML reporter which better aggregate test results in a user-friendly HTML view. It provides test results, time taken by each test module, assertions made in each test case along with raw HTTP logs which help with debugging.
Configuration
The HTML reporter is enabled by default, along with the JUnit XML and JSON reporters, but its behaviour can be configured as follows:
Via the config file
The output_folder config settings is used to specify the location where the HTML report files will be saved. Nightwatch writes the HTML report inside a sub-folder called nightwatch-html-report.
module.exports = {
  output_folder: 'tests_output'
}
Refer to the Configuration > Output settings page for a complete list of test output related settings.
Via the CLI
You can also configure the output folder at runtime via the CLI, using the --output flag:
nightwatch --output ./tests-outputRefer to the CLI reference page for a complete list of CLI flags that Nightwatch accepts.
Usage
Step 0: create a new project
First, let's create a new empty project and install Nightwatch inside it:
mkdir ./test-project && cd ./test-projectStep 1: install Nightwatch and chromedriver
Install nightwatch and chromedriver from NPM (chromedriver is the W3C WebDriver implementation for running tests in the Google Chrome browser; make sure you have the latest Chrome browser installed on your machine):
npm i nightwatch chromedriverStep 2: run an example test and view the HTML reporter
Consider the duckDuckGo.js example test:
describe('duckduckgo example', function() {
  it('Search Nightwatch.js and check results', function(browser) {
    browser
      .navigateTo('https://duckduckgo.com')
      .waitForElementVisible('#search_form_input_homepage')
      .sendKeys('#search_form_input_homepage', ['Nightwatch.js'])
      .click('#search_button_homepage')
      .assert.visible('.results--main')
      .assert.textContains('.results--main', 'Nightwatch.js');
  });
});
By default, all the built-in reports are generated (HTML, Junit-XML, and JSON), so you don't have to do anything else. Run the tests as usual:
npx nightwatch examples/tests/duckDuckGo.js --env chromeTo generate only the built-in HTML report, run the following command:
npx nightwatch examples/tests/duckDuckGo.js --env chrome --reporter=htmlTo generate both the built-in JUnit-XML and HTML reports, run the following command (v2.2+):
npx nightwatch examples/tests/duckDuckGo.js --env chrome --reporter=junit --reporter=htmlStep 3: view the HTML report
The HTML report should have been generated in the local tests_output folder inside the current project directory. It will look something like this:
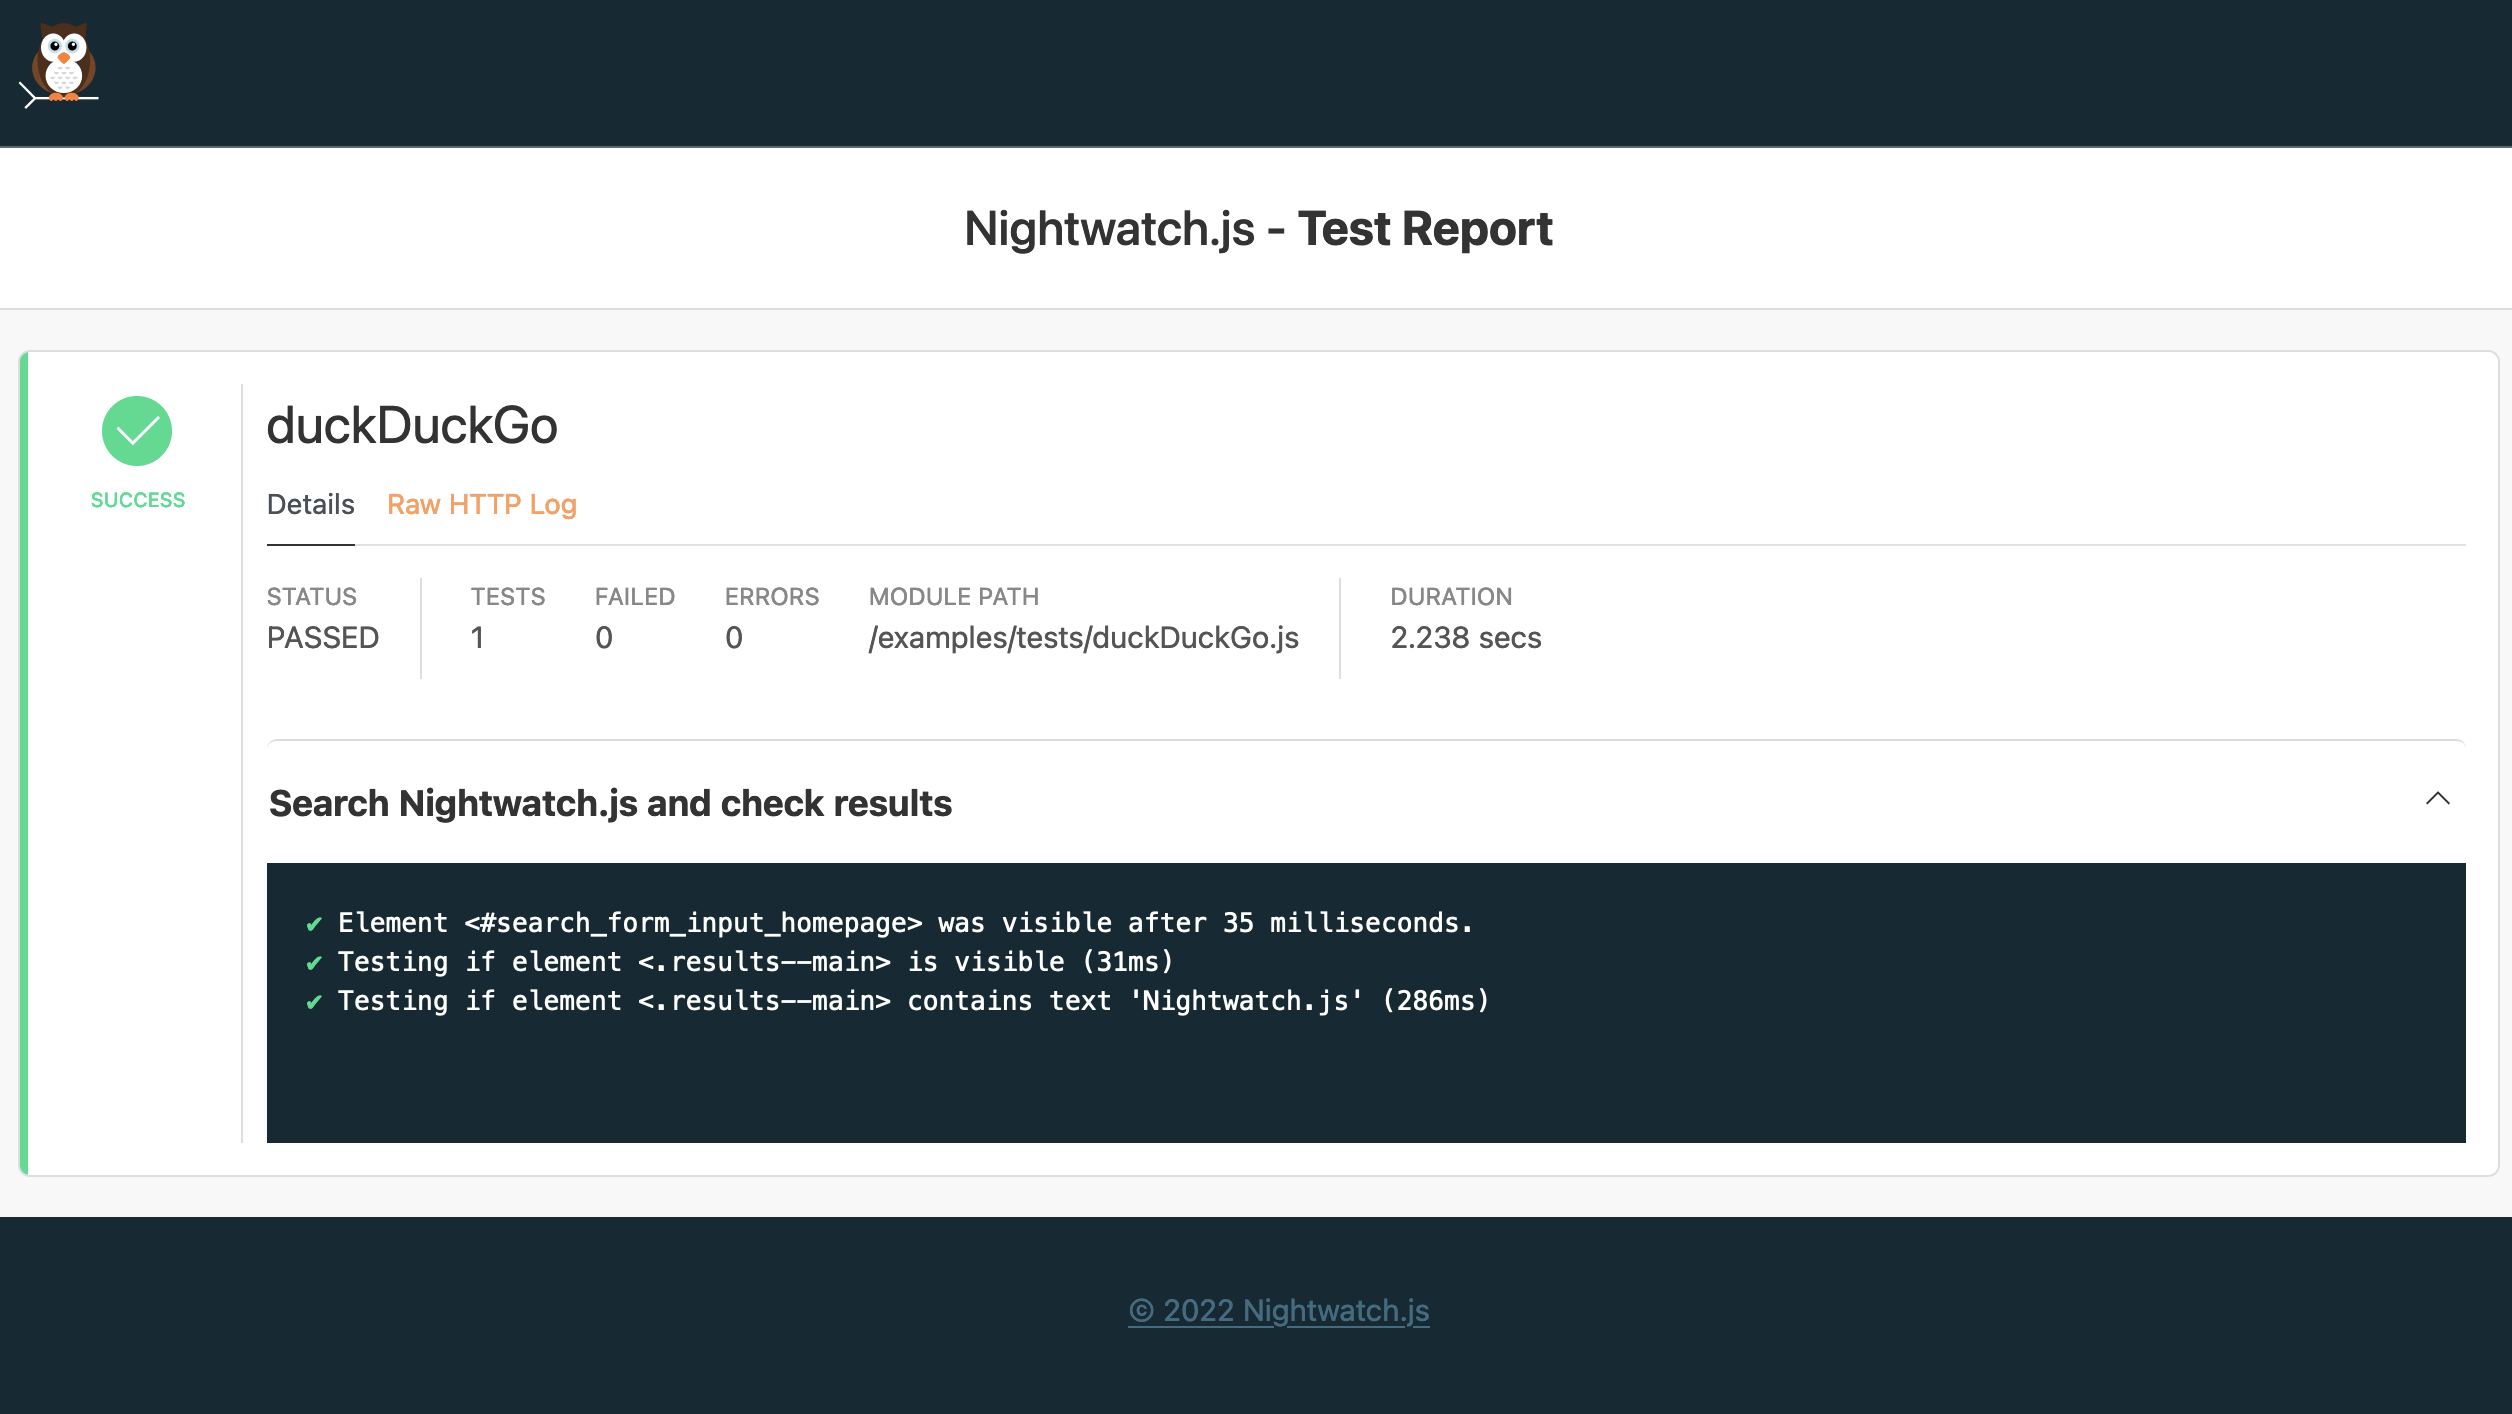
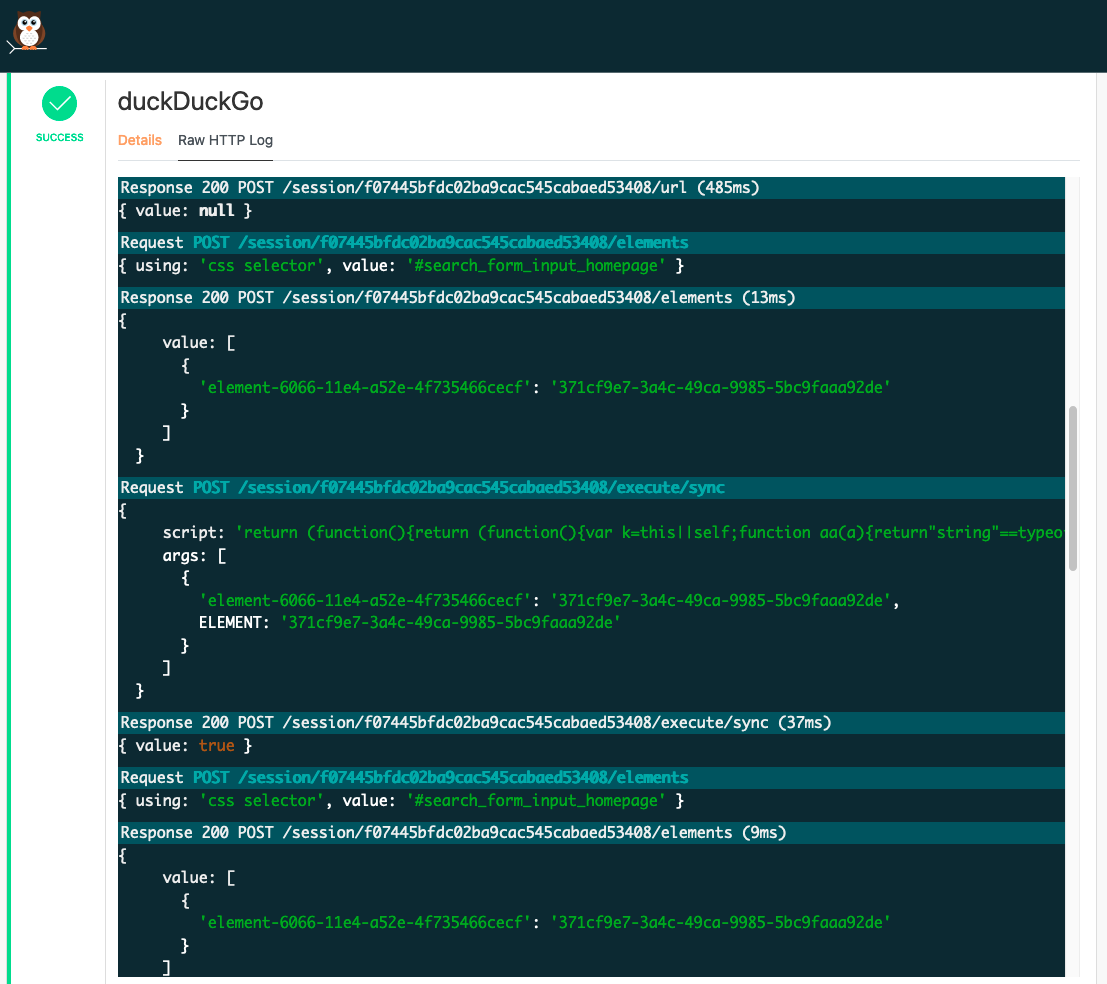
View the HTTP raw logs
Raw HTTP logs contain all the detailed HTTP request/response traffic between Nightwatch and the Selenium/WebDriver and are included in the report by default for each test session:
Automatically open the report
Use the --open command line argument to open the generated HTML report generated in the default browser:
npx nightwatch examples/tests/duckDuckGo.js --env chrome --reporter=html --open