Debugging component tests in Nightwatch
Overview
Debugging component tests in Nightwatch isn't as straightforward as debugging a regular Node.js application or service, since Nightwatch needs to inject the code to render to component into the browser.
However, since Nightwatch v2.4 we provide several ways to inspect and debug the mounted component using the browser devtools console.
Preview the component
Nightwatch provides the ability to run a component tests in preview mode (using the --preview CLI argument) which would only open the Vite test renderer and pause the execution indefinitely.
This can be useful during development, since the Vite renderer has the ability to automatically reload the component via its built-in Hot Module Replacement (HMR) functionality.
You can use the Nightwatch built-in parallelism to open the story in both Firefox and Chrome:
Debug the component
In addition to previewing the story, it's also possible to use Nightwatch to debug the story. Here's how to do this:
- pass the
--debugand--devtoolsCLI flags – this will inject the.debug()command right after the component is rendered - use the
debuggerstatement to add breakpoints insideplay()function.
Example (React)
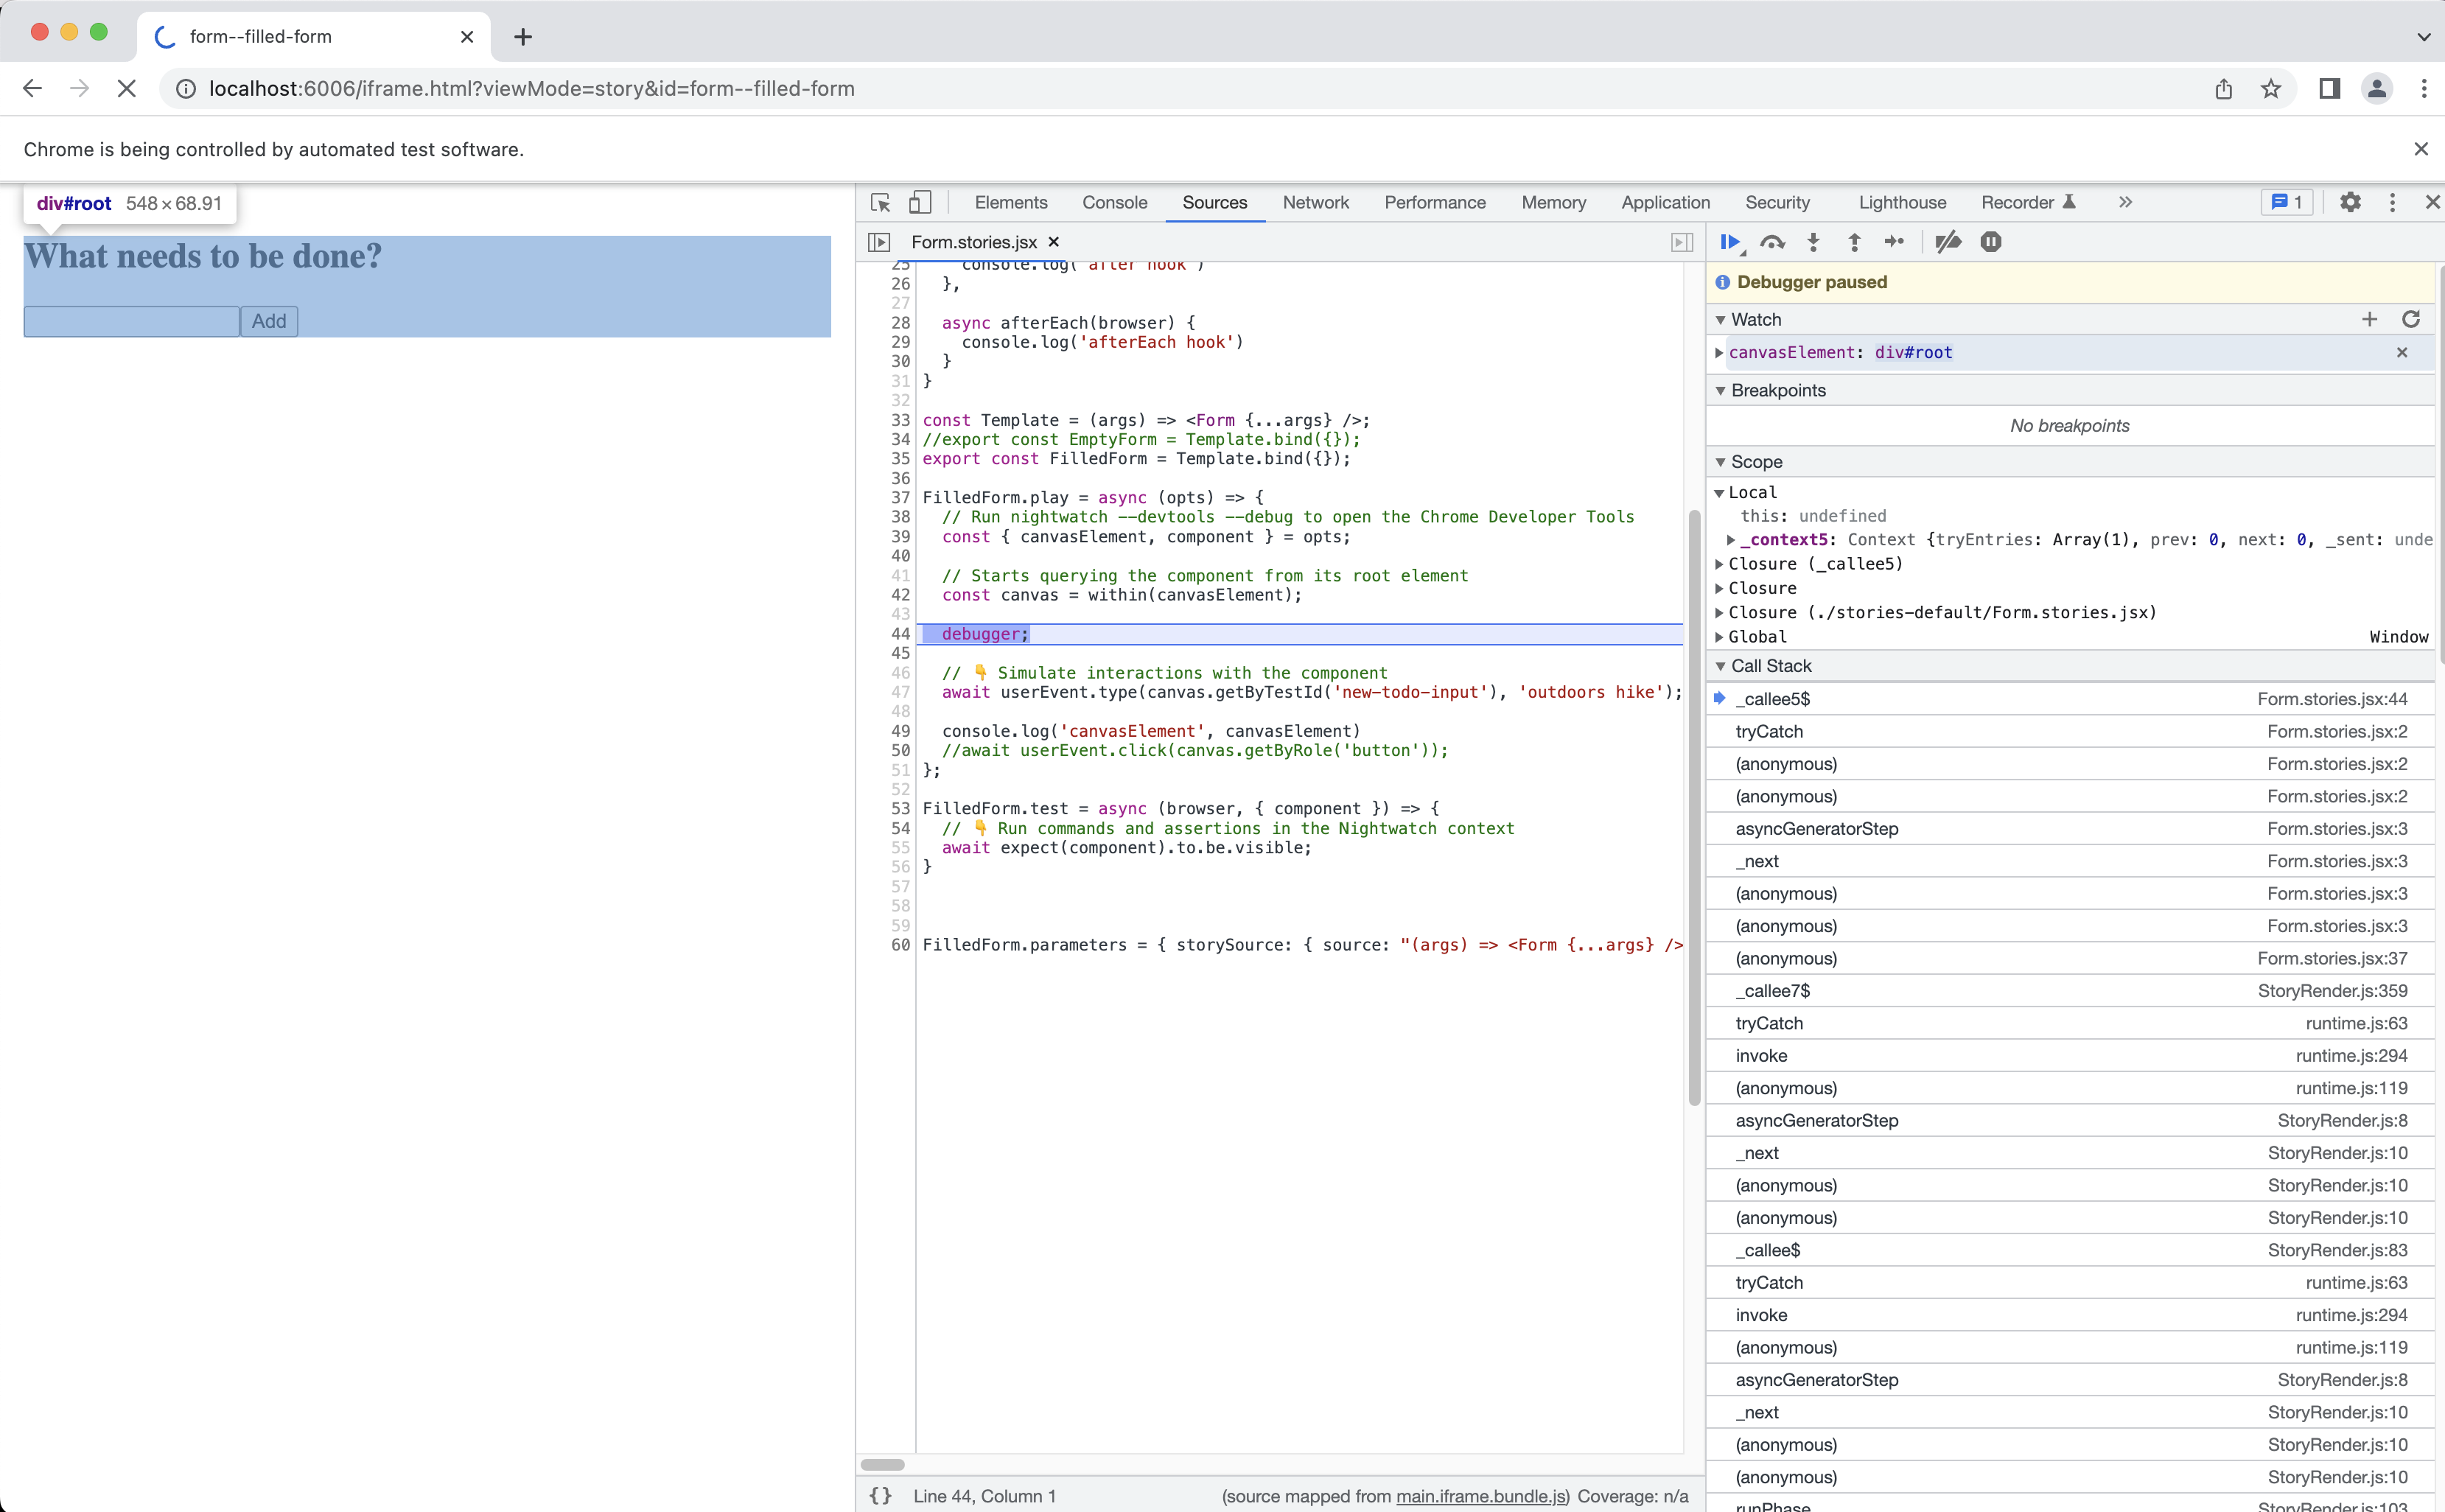
In the example below, we use the debugger to debug the play() function using the browser Devtools. This functionality is currently available in Chrome, Edge, and Safari.
This example is based of a Storybook project with the @nightwatch/storybook plugin installed. Refer to the Storybook integration page for more details.
import { userEvent, within } from '@storybook/testing-library';
import Form from './Form.jsx';


export default {
  title: 'Form',
  component: Form,
}


const Template = (args) => <Form {...args} />


// Component story for an empty form
export const EmptyForm = Template.bind({});


// Component story simulating filling in the form
export const FilledForm = Template.bind({});


FilledForm.play = async ({ canvasElement }) => {


  // Starts querying the component from its root element
  const canvas = within(canvasElement);


  debugger;


  // 👇 Simulate interactions with the component
  await userEvent.type(canvas.getByTestId('new-todo-input'), 'outdoors hike');
  await userEvent.click(canvas.getByRole('button'));
};


FilledForm.test = async (browser, { component }) => {
  // 👇 Run commands and assertions in the Nightwatch context
  await expect(component).to.be.visible;
}
Run the example and observe the breakpoint in the Chrome devtools console.
You can also use the integrated debug console to issue commands from Nightwatch.